

THE 90-DAY SUPPLIER AUDIT THAT SAVED ₹18 LAKH (AND WHAT WE FOUND THAT SHOCKED US)

THE 90-DAY SUPPLIER AUDIT THAT SAVED ₹18 LAKH (AND WHAT WE FOUND THAT SHOCKED US)

When I joined a manufacturing company, sourcing was already running.
Products were coming in
Orders were going out
Suppliers were delivering on time
Nobody was complaining.
From the outside, it looked fine.
So in the first few weeks, I focused on other things —
Marketplace Setup
Listings
Operations
Sourcing seemed stable
Why disturb something that wasn't broken? Then I started asking questions.
Not because anything was visibly wrong. But because I had a habit from previous work: when something hasn't been questioned in a while, question it.
What I found over the next 90 days changed how I think about supplier management permanently.
━━━━━━━━━━━━━━━━━━━━━━━━━━━━━━━━━━━━━━━━━
HOW THE AUDIT STARTED
It began with a simple question I asked the person managing procurement: "When did we last compare our supplier prices against current market rates?"
The answer: "These relationships have been in place since the beginning. We trust them."
Trust is not a procurement strategy.
I'm not saying trust is unimportant — supplier relationships absolutely matter. But trust and verification are not opposites. You can have both. You should have both.
I proposed a 90-day audit. Not to replace suppliers. Not to damage relationships. Simply to understand whether what we were paying reflected current market reality.
The audit covered four areas:
→ Price comparison against current market
→ Quality performance over the previous 12 months
→ Payment terms versus industry standard
→ Hidden costs nobody had formally calculated
What we found in each area was instructive.
━━━━━━━━━━━━━━━━━━━━━━━━━━━━━━━━━━━━━━━━━
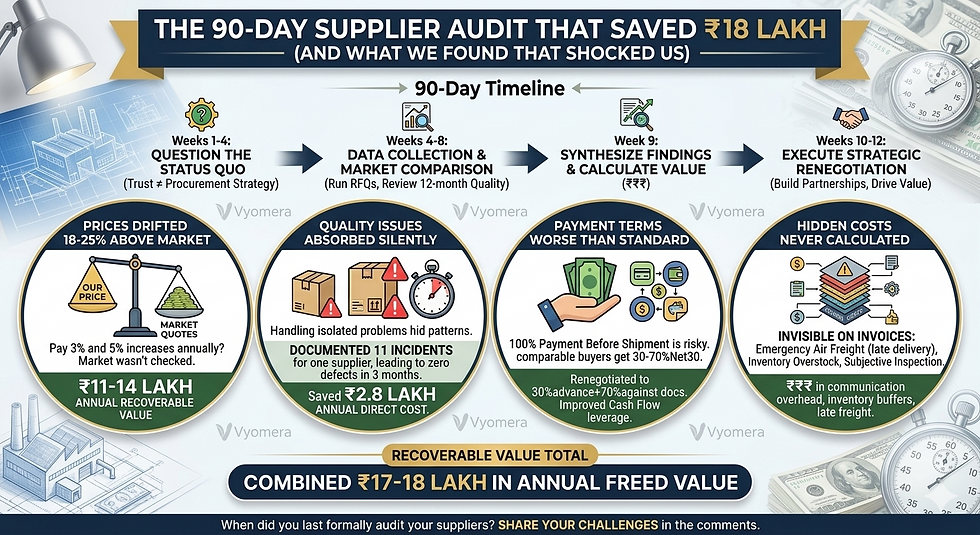
FINDING #1: PRICES HAD DRIFTED 18-25% ABOVE MARKET
This was the first and largest finding.
Over time, supplier prices had been revised upward. Small increases. 3% here. 5% there. Each individual increase seemed reasonable. Inflation. Material costs. Currency movement.
But nobody had tracked the cumulative effect. And nobody had compared cumulative increases against what the market was actually offering.
When I ran RFQs — Request for Quotations — to alternative suppliers for our top eight product categories, the gap was significant.
For five out of eight categories, we were paying 18-25% above what comparable alternative suppliers were quoting for equivalent specifications.
On some products the gap was explained by genuinely better quality from our existing supplier. That's a valid reason to pay more.
On others, the gap had no justification...
Same specifications
Same materials
Same certifications.
Just a price that had quietly drifted upward over years of small increments without market comparison.
Annual spend on those categories: approximately ₹72 lakh. Recoverable saving through renegotiation or switching: ₹11-14 lakh.
This finding alone justified the entire audit.
━━━━━━━━━━━━━━━━━━━━━━━━━━━━━━━━━━━━━━━━━
FINDING #2: QUALITY ISSUES WERE BEING ABSORBED SILENTLY
The second finding was subtler — and in some ways more concerning.
When I reviewed the previous 12 months of inbound shipments systematically, a pattern emerged that nobody had formally tracked.
Three suppliers had recurring quality issues
Not catastrophic failures
Small things
A batch with slightly inconsistent dimensions
A shipment where 4-5% of units had minor cosmetic defects
A material that tested slightly below the specified grade.
Each incident had been handled individually. A complaint raised. A replacement sent. The immediate problem resolved.
But nobody had looked at the cumulative picture.
Supplier A: 7 quality incidents in 12 months, affecting approximately 3% of total units received.
Supplier B: 11 incidents, affecting 5% of total units, concentrated in two specific product categories.
Supplier C: 4 incidents, but each involving a significant batch, affecting nearly 8% of one product category over the year.
The cost of handling these incidents —
replacement units
additional logistics
operational time, and
the customer service impact
— had never been formally calculated. It was just part of "the cost of doing business."
When I calculated it: approximately ₹2.8 lakh in direct costs. Plus an unknown amount in customer trust impact.
Supplier B's quality performance was the most concerning. Eleven incidents in twelve months is not bad luck. It's a systemic problem.
The response in the past had been to handle each incident and move on. The correct response — which we implemented — was to formally notify the supplier that their quality performance was being documented and evaluated, present the data, and require a quality improvement plan with measurable targets.
The supplier's response was immediate and serious. They had not realized the cumulative scale. Within three months, quality incidents from that supplier dropped to zero.
Accountability requires documentation. Without records, every problem is isolated. With records, patterns become visible — and actionable.
━━━━━━━━━━━━━━━━━━━━━━━━━━━━━━━━━━━━━━━━━
FINDING #3: PAYMENT TERMS WERE WORSE THAN INDUSTRY STANDARD
The third finding was about payment terms — and it revealed how much money was leaving without anyone noticing.
Our standard payment structure with most suppliers:
30% advance at order confirmation
70% before shipment.
This is common. Many manufacturers accept it without question.
But it is not the only option. And for established buying relationships — which ours were — it is often not the best achievable option.
When I researched what comparable buyers were getting from similar suppliers, the picture was different.
Buyers with 12-24 months of consistent order history were routinely negotiating:
→ 20% advance, 80% against shipping documents (after goods shipped, not before)
→ 30% advance, 70% net 30 (payment 30 days after delivery)
→ Letter of Credit terms for larger orders (payment triggered by compliant shipping documents)
We were paying 100% before goods even left the supplier's facility on most orders. Which meant we were fully funding production and sitting on the financial risk of any shipment problem — delays, damage, quality failures — with no leverage.
Renegotiating to 30% advance and 70% against shipping documents on our three largest suppliers improved our effective working capital position by approximately ₹3.2 lakh per month.
That's ₹3.2 lakh that was no longer sitting locked in advance payments at any given point. Available for other operations. Available as a buffer. Available as leverage.
Nobody had asked for better terms. So nobody had received them.
━━━━━━━━━━━━━━━━━━━━━━━━━━━━━━━━━━━━━━━━━
FINDING #4: HIDDEN COSTS NOBODY HAD CALCULATED
The fourth finding was the most surprising — because it was entirely invisible until someone looked for it.
Hidden costs in sourcing don't appear on any invoice. They accumulate in...
Operational time
Logistics inefficiencies, and
Process friction that everyone accepts as normal.
We found four specific hidden costs:
Hidden cost #1: Communication overhead
Two suppliers required significant back-and-forth to confirm every order...
Specification queries
Clarification requests
Multiple rounds of sample approval for products that had been ordered dozens of times before.
The time cost per order: approximately three to four hours of staff time across multiple interactions.
Across 60+ orders annually from these suppliers: 180-240 hours of operational time. At any reasonable cost of staff time, that's a real number.
The fix: standardized order sheets with complete specifications, pre-approved samples on file, and a clear escalation protocol for genuine variations. Reduced communication time per order by 70%.
Hidden cost #2: Emergency freight
Three times in the previous year, a supplier had delivered late enough that we needed to use air freight instead of sea freight to meet committed delivery timelines.
Air freight cost versus sea freight cost differential: approximately ₹85,000 per incident.
Three incidents: ₹2.55 lakh in emergency freight charges that wouldn't have occurred with earlier order placement and better supplier lead time tracking.
The fix: earlier purchase order placement with explicit delivery deadline commitments and a formal late delivery penalty clause.
Hidden cost #3: Inventory buffer overstocking
Because certain suppliers had inconsistent lead times — sometimes 30 days, sometimes 45 days, occasionally 60 days — we were holding larger safety stock than necessary to protect against variability.
Excess safety stock across affected SKUs: approximately ₹8 lakh in inventory value locked at any point.
At 12% annual capital cost, that excess stock was costing approximately ₹96,000 per year in pure financing cost.
The fix: requiring suppliers to provide reliable lead time commitments with variance data, then calibrating safety stock to actual verified lead time, not worst-case assumptions.
Hidden cost #4: Inspection failures and re-inspection
Pre-shipment inspections were being conducted, but with no standardized checklist. Inspectors were applying subjective judgment. Two inspections in the previous year had passed goods that subsequently failed internal checks on arrival.
Cost of those two failures: ₹68,000 in return logistics and replacement processing.
The fix: a written inspection checklist for each product category with objective pass/fail criteria. Not complex — two pages per category — but specific enough that any inspector applies consistent standards.
━━━━━━━━━━━━━━━━━━━━━━━━━━━━━━━━━━━━━━━━━
THE TOTAL: ₹18 LAKH IN RECOVERABLE VALUE
When I consolidated everything the audit surfaced:
Price renegotiation (5 categories): ₹11-14 lakh annually
Quality incident cost reduction: ₹2.8 lakh annually
Working capital improvement from payment terms: ₹3.2 lakh freed monthly
Emergency freight elimination: ₹2.5 lakh annually
Inventory carrying cost reduction: ₹96,000 annually
Inspection failure cost elimination: ₹68,000 annually
Combined: ₹17-18 lakh in annual value recovered or freed.
From a sourcing operation that was already "running fine."
━━━━━━━━━━━━━━━━━━━━━━━━━━━━━━━━━━━━━━━━━
WHAT THE AUDIT DIDN'T DO
Important to say clearly: the audit did not damage any supplier relationships.
Every conversation with suppliers was framed as partnership improvement, not accusation. We shared data. We explained what we were looking for. We gave them the opportunity to respond and improve.
The supplier with quality issues — who had been on the verge of being replaced — became one of our most reliable suppliers after we formally documented the problem and gave them clear targets.
The supplier with the highest price gap renegotiated to a more competitive rate and maintained the relationship because they valued the consistent order volume and professional communication.
One supplier we did exit — not because of price or quality, but because their communication overhead was genuinely unsustainable and three attempts to improve the process had produced no change. That was the right decision. Not every supplier relationship is worth preserving.
The point of an audit is not to create conflict. It is to see clearly. You cannot manage what you cannot see.
━━━━━━━━━━━━━━━━━━━━━━━━━━━━━━━━━━━━━━━━━
THE QUESTION EVERY MANUFACTURER SHOULD ASK
When did you last formally audit your supplier relationships?
Not casually review.
Not assume things are fine because nothing is visibly broken.
Facts
Formally compare prices against current market.
Formally review quality performance data for the past 12 months.
Formally evaluate whether payment terms reflect your current standing as a buyer.
Formally calculate the hidden costs that never appear on any invoice.
If the honest answer is "more than 12 months ago" — or "never" — the audit is overdue.
The money is almost certainly there. It just hasn't been looked for.
Have you ever done a formal supplier audit? What did you find? Drop it in the comments — genuinely curious what others have discovered.
Comments